Tracewave: Real-Time Anomaly Detection on a Live Firehose
Real-Time Anomaly Detection on a Live Firehose
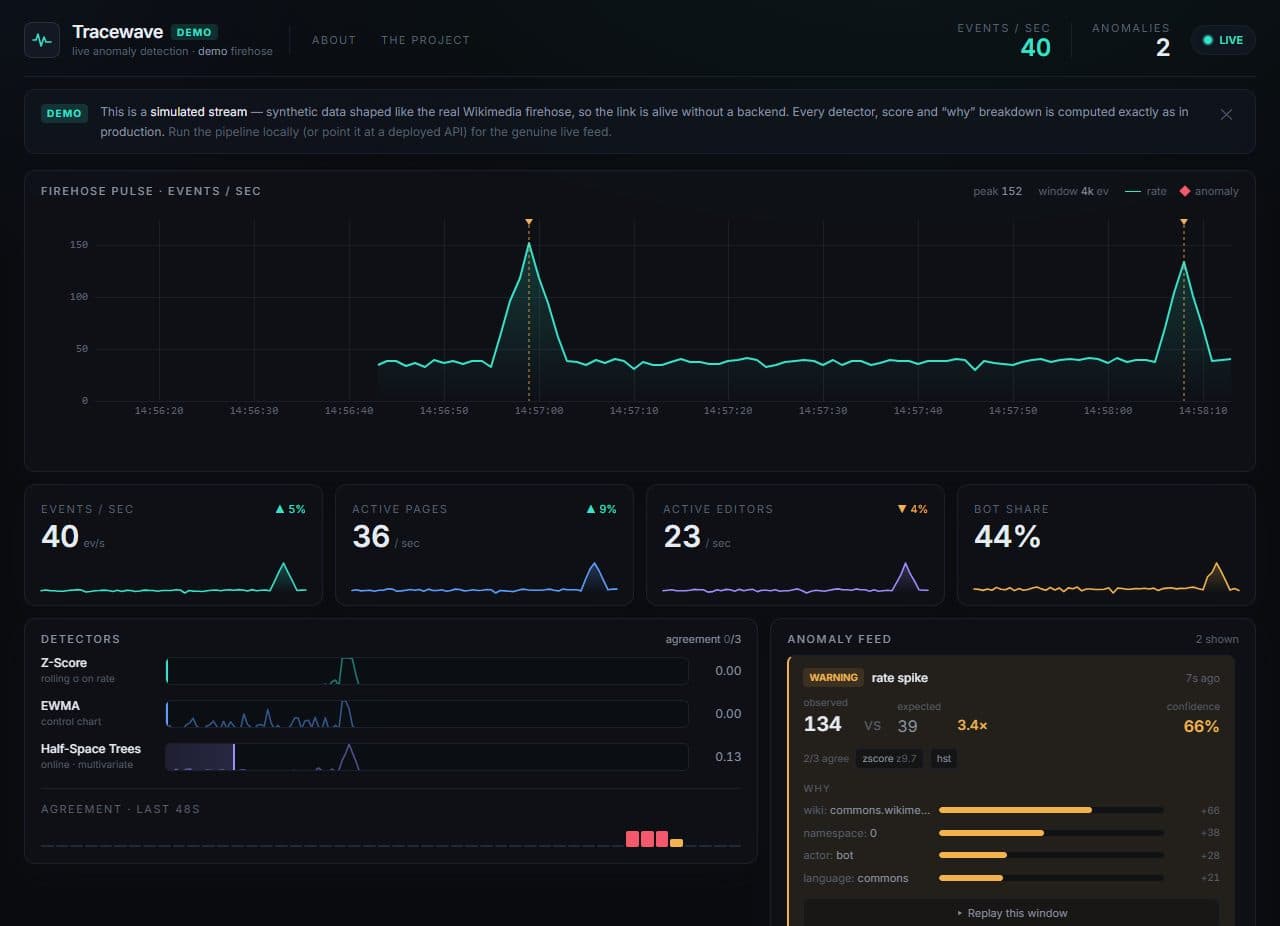
A streaming pipeline that reads every Wikipedia edit as it happens, runs three online anomaly detectors in parallel, and pushes live metrics and explained anomalies to an ops dashboard over WebSockets. The data is real and live, with no refresh.
- Year
- Jan 2026
- Timeline
- 9 weeks
- Type
- Data Engineering
- Status
- Live
~30–60/s
Live Wikipedia edits ingested per second from the Wikimedia firehose, folded into 1-second windows and scored by three online detectors in parallel.
Overview
Most data portfolios show a static notebook. Tracewave is a live distributed system: ingestion, a stream bus, windowed stream processing, online ML, time-series storage and a real-time frontend, plus its own observability. It maintains rolling windows over the Wikimedia EventStreams firehose, runs three anomaly detectors at once, and puts an anomaly card on the dashboard with the evidence and a confidence score as soon as something unusual spikes.
The hard parts
- 01
The firehose bursts; without bounded buffers it either grows without limit or crashes.
- 02
Three detectors give three different opinions, which have to become one confidence score.
- 03
A spike that just says "spike" is useless; each anomaly needs a "why."
- 04
Keeping the demo populated even with no backend wired up.
The approach
The same Processor core runs as one in-memory process in dev or split across Redis and Timescale containers in prod, so it does not depend on the transport. Events fold into 1-second tumbling windows on a supplied clock (deterministic and unit-tested), then three online detectors score them: a rolling z-score, an EWMA control chart, and river's multivariate Half-Space Trees. The ensemble rewards agreement, so 3 of 3 firing corroborates and 1 of 3 is suppressed unless it is very strong. For the "why," it keeps a decaying per-dimension baseline and diffs the spiking window against it, so a card reads "+312 edits, ~98% from en.wikipedia.org, namespace 0, bot actors" instead of just "anomaly."
Outcome
Open the dashboard and events are flowing, sparklines updating, and anomaly cards arriving with their evidence. Backpressure sheds oldest-first and counts the drops, the ingestor reconnects with backoff and resumes from the last event id, every service exposes Prometheus metrics, and 22 tests cover the windowing and detector math. A deployed link falls back to an in-browser demo stream, so the page always shows data.
What I'd do differently
It is the full data-platform stack end to end, which is also its weakness: there are a lot of moving parts to keep healthy. I would add a schema registry for the firehose sources and rely more on the source registry, so swapping Wikipedia for another stream takes one entry instead of a refactor.
Stack
Like what you see?
Let's build the next one.
Hiring, or have a problem that needs this kind of engineering? I read every message myself.